Club Operations
How to Answer Every Board Question in Under Two Minutes
Your swim club board asks tough questions. Learn how management reporting software helps you pull accurate answers in seconds, not hours.

You're sitting at the monthly board meeting when someone asks, "How many members did we lose last quarter compared to last year?" Then another board member jumps in: "And what's our average revenue per member this season?" You feel your stomach drop. You know this data exists somewhere in your spreadsheets, but pulling it together means an hour of digging through files after the meeting. Sound familiar? This is exactly where management reporting software changes everything for swim club operators like you and me.
Why Saturday Morning Questions Feel Impossible to Answer
Every Saturday morning brings a fresh batch of questions. Parents want to know their account balance. Your front desk staff needs to verify who's paid their seasonal fees. Board members text you asking about utilization rates for the lap lanes versus the family swim area.
Here's the problem: if you're running reports by hand or juggling multiple spreadsheets, each question becomes a research project.
I've watched club managers spend their entire Sunday afternoon preparing for Monday board meetings. They're copying data from the check-in system, cross-referencing it with billing records, and manually calculating percentages in Excel. One typo throws everything off. One forgotten export means starting over.
Management reporting software solves this by pulling all your club data into one place and letting you answer questions in real time.
The Hidden Cost of Manual Report Building
Most swim clubs don't realize how much time they waste on reporting until they track it. According to CFO.com's analysis of spreadsheet dependency , organizations lose significant productivity to manual data compilation and error correction.
Think about your typical month:
- Week 1: Pull attendance numbers for the monthly operations review
- Week 2: Calculate renewal rates for the finance committee
- Week 3: Export member demographics for the marketing discussion
- Week 4: Compile revenue reports for the board packet
Each task takes 30 to 90 minutes. That's four to six hours every month just gathering numbers you already have. Now multiply that by twelve months, and you're looking at a full work week spent on manual reporting.
| Task | Time Without Software | Time With Software | Hours Saved Monthly |
|---|---|---|---|
| Monthly attendance report | 60 min | 5 min | 0.9 hours |
| Renewal rate analysis | 45 min | 3 min | 0.7 hours |
| Revenue breakdown | 90 min | 5 min | 1.4 hours |
| Member demographics | 30 min | 2 min | 0.5 hours |
| Total | 225 min | 15 min | 3.5 hours |

What Management Reporting Software Actually Does
Let's cut through the jargon. Management reporting software connects to your club's data (memberships, billing, check-ins, reservations) and organizes it so you can answer questions fast.
Instead of opening five different spreadsheets and doing math by hand, you open one dashboard. Want to see how many new members joined this month? It's right there. Need to compare this summer's revenue to last summer? Two clicks.
The Three Things Good Reporting Software Handles
Real-time data connection: The software pulls fresh numbers from your member database, billing system, and check-in records automatically. When someone checks in this morning, that check-in shows up in your attendance reports immediately.
Pre-built reports: You don't start from scratch every time. The software includes templates for the reports clubs actually need: membership trends, revenue by category, facility usage, renewal rates, outstanding balances.
Custom views: You can slice the data different ways depending on who's asking. The board wants year-over-year comparisons. Your front desk needs today's expected arrivals. Your treasurer wants payment method breakdowns. Same data, different angles.
Modern platforms like Clubward take this further by offering AI-powered insights that surface patterns you might miss, helping you spot issues like declining check-in rates or unusual billing trends before they become problems.
The Five Reports Every Swim Club Actually Uses
After working with dozens of clubs, I can tell you that most facilities rely on the same five core reports. You might call them different names, but the information needs are universal.
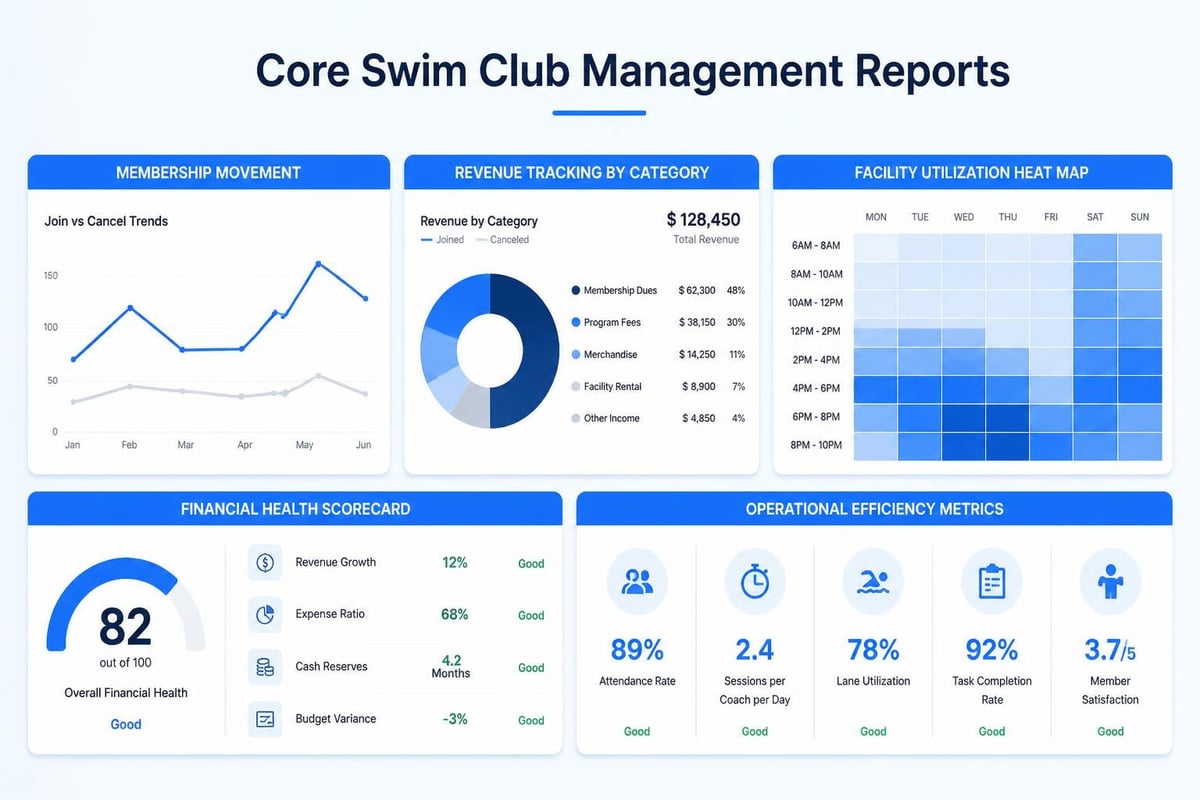
Membership Movement Report
This shows you who joined, who left, and who's up for renewal. You need this broken down by month so you can spot seasonal patterns.
What it answers:
- Are we growing or shrinking?
- Which months see the most cancellations?
- How many renewals are coming up next month?
- What's our retention rate compared to last year?
Revenue Tracking Report
Money questions come up at every board meeting. This report breaks down where your revenue comes from and how it compares to budget or prior periods.
- Monthly dues collected
- Guest fees and daily passes
- Late fees and reinstatement charges
- Revenue by membership tier
- Outstanding balances by aging category
Facility Utilization Report
Your board needs to justify capital improvements and operating hours. This report proves which facilities get used and when.
Key metrics:
- Check-ins by day of week
- Peak hours versus quiet hours
- Capacity utilization (how full you are during open hours)
- Amenity-specific usage (lap lanes, diving well, party room)
Financial Health Dashboard
Your treasurer and finance committee want the big picture at a glance. This dashboard combines multiple data points into one view.
| Metric | This Month | Last Month | Year Ago | Trend |
|---|---|---|---|---|
| Active memberships | 487 | 492 | 461 | ↑ 5.6% |
| Monthly recurring revenue | $38,450 | $38,780 | $36,320 | ↑ 5.9% |
| Collection rate | 94% | 91% | 89% | ↑ 5.6% |
| Average balance per account | $127 | $142 | $156 | ↓ 18.6% |
Operational Efficiency Metrics
This one's for you, the operator. It tracks how smoothly your club runs day-to-day.
- Average check-in time
- Failed payment attempts
- Member portal adoption rate
- Support tickets by category
- Staff time spent on billing questions
When you have AI-powered insights working behind the scenes, these metrics can trigger automatic alerts when something needs your attention, like a spike in failed payments or unusual no-show patterns.
How to Choose Reporting Software That Actually Works
Not all management reporting software works the same way. Some tools bury their reporting features three menus deep. Others give you so many options that finding a simple answer takes longer than building a spreadsheet.
Here's what to look for when you're evaluating options:
Data Integration That Makes Sense
The software needs to connect to where your data lives right now. If you're using separate systems for billing and check-ins, can the reporting tool pull from both? Or will you still be exporting CSVs and copying data around?
Ask vendors these specific questions:
- Does it pull data automatically or do I have to export and import files?
- How often does the data refresh (real-time, hourly, daily)?
- Can it handle data from our previous software if we switch?
- What happens if our internet goes down temporarily?
Red flag: If the vendor can't explain data integration in plain English, that's a sign their product is overly complicated.
Reports You Can Build Yourself
You shouldn't need a computer science degree to create a new report. Look for drag-and-drop interfaces where you can select the data you want, choose how to group it, and set your date range.
Modern platforms offer templates you can customize rather than forcing you to start from scratch. Need to modify the standard revenue report to break out swim lesson fees separately? That should take two minutes, not two hours.
The Clubward platform features include configurable reporting templates specifically designed for swim clubs, tennis facilities, and HOA pools, so you're not adapting generic business software to club operations.
Mobile Access for On-the-Go Answers
Board members email you questions at 9 PM on Sunday. Parents stop you in the parking lot asking about their account. Your treasurer calls from vacation with a budget question.
You need reporting software that works on your phone, not just your office computer. Look for:
- Responsive design that reformats for small screens
- Key metrics available without endless scrolling
- Ability to share reports via email or link
- Quick access to member account details
Security and Access Controls
Your reporting software will contain sensitive member information. Revenue numbers. Account balances. Personal contact details.
You need role-based permissions so board members can see aggregate trends without accessing individual member data. Your front desk staff needs real-time check-in data but shouldn't pull financial reports.
Understanding data governance fundamentals helps you ask the right security questions when evaluating software vendors, ensuring your member information stays protected while remaining accessible to authorized users.
Setting Up Your First Automated Reports
Once you've chosen management reporting software, the setup process determines whether it actually saves you time or creates more work.
Start With Three Core Reports
Don't try to automate everything on day one. Pick the three reports you build most often and set those up first.
For most clubs, that's:
- Monthly membership count (total members, new joins, cancellations)
- Revenue summary (dues collected, outstanding balances, payment method breakdown)
- Weekly facility usage (check-ins by day, peak time identification)
Get these three working perfectly before you tackle anything else. This gives you quick wins and helps you learn how the software works.
Map Your Data Fields Correctly
This is where most implementations go wrong. Your old system called something "membership type" while your new software calls it "plan category." If you map these incorrectly, your reports will be garbage.
Take your time with field mapping:
- List all the data points you currently track
- Identify which field in the new system matches each data point
- Test with a small sample before running full reports
- Verify totals against your known numbers
For example, if you know you had exactly 489 active members on June 30, run that report in your new system for June 30. Does it show 489? If not, something's mapped wrong.
Schedule Automatic Report Delivery
The best management reporting software sends reports to you automatically. You shouldn't have to remember to pull them.
Set up automatic delivery for:
- Daily: Check-in summary sent to operations team each morning
- Weekly: Facility utilization sent to facility manager every Monday
- Monthly: Full financial packet sent to board members three days before meetings
- Quarterly: Retention and growth analysis sent to leadership committee
This turns reporting from an active task (something you have to do) into a passive process (something that happens automatically).
When you're migrating to new swim club software , having automated report delivery means you'll notice data issues quickly, while there's still time to fix mapping problems.
Common Reporting Mistakes Club Managers Make
Even with good software, you can still create reports that don't actually help. Here are the mistakes I see most often.
Tracking Too Many Metrics
More data doesn't mean better decisions. I've seen club managers create dashboards with 47 different metrics, then feel overwhelmed every time they look at it.
Stick to the metrics that drive decisions:
- If you can't explain why you're tracking it, stop tracking it
- If a metric hasn't changed your actions in six months, remove it
- If board members glaze over when you present it, it's not useful
Focus on 8-12 key metrics that actually matter for your specific club.
Comparing Apples to Oranges
Last year your pool was closed for renovations in May. This year it wasn't. Comparing May 2025 to May 2026 makes your growth look artificially high.
Be careful with:
- Seasonal variations: Summer versus winter usage patterns
- Calendar differences: Months with 28 days versus 31 days
- Operational changes: New programs, facility additions, rate increases
- External factors: Weather patterns, local competition, economic conditions
Good management reporting software lets you add notes and context to your reports, so viewers understand what they're seeing.
Ignoring Data Quality Problems
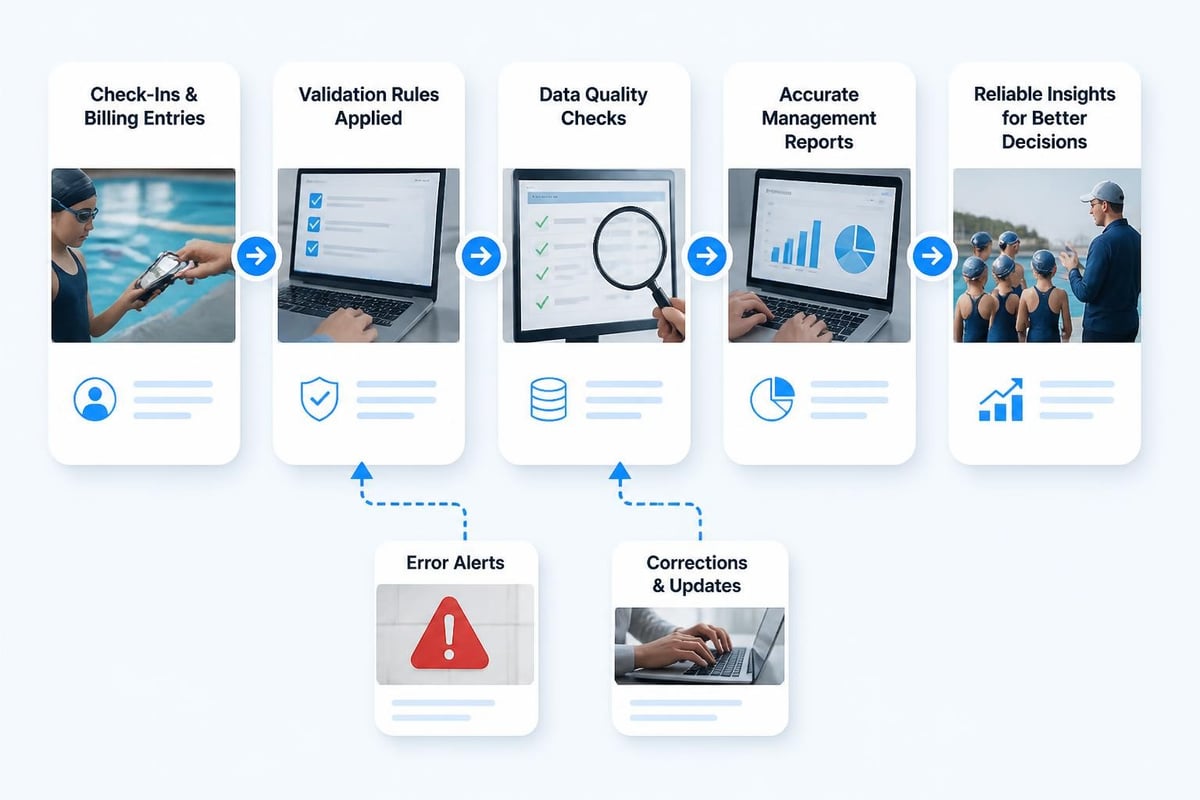
Your reports are only as good as your underlying data. If front desk staff aren't checking people in consistently, your utilization reports are meaningless. If billing entries get mis-coded, your revenue breakdowns are wrong.
Signs of data quality problems:
- Numbers that jump around unexpectedly
- Percentages that don't add up to 100%
- Totals that don't match your bank deposits
- Member counts that contradict your actual roster
Research from TDWI on data quality practices shows that organizations often underestimate how much bad data undermines their reporting efforts. Investing in data quality controls pays off through more trustworthy reports.
Platforms like Clubward address this through built-in validation rules and AI-powered anomaly detection that flags unusual patterns for review, helping you catch data issues before they corrupt your reports.
Advanced Reporting Techniques for Growing Clubs
Once you've mastered the basics, management reporting software can help you answer more sophisticated questions.
Cohort Analysis for Retention Insights
Instead of asking "What's our overall retention rate?" ask "How well do we retain members who joined in January versus those who joined in June?"
Cohort analysis groups members by when they joined, then tracks how those groups behave over time. You might discover that members who join during summer have a 72% renewal rate, while those who join in fall have an 89% renewal rate.
That insight changes your marketing strategy. You focus acquisition efforts on times when you attract members who stick around longer.
Predictive Metrics for Proactive Management
Modern reporting tools can identify patterns that predict future behavior:
- Members who haven't checked in for 30 days are 68% more likely to cancel
- Accounts with balances over $200 have a 41% non-renewal rate
- Families who use the pool less than twice monthly during their first 60 days rarely renew
When you spot these patterns, you can intervene. Send a friendly check-in email to members who haven't visited recently. Offer payment plans before balances grow too large. Run orientation sessions to help new members get engaged quickly.
The AI insights available in Clubward surface these patterns automatically, so you don't need to be a data scientist to benefit from predictive analytics.
Benchmark Reports for Board Presentations
Your board wants to know how your club compares to others. Industry benchmark reports put your numbers in context.
Useful benchmarks include:
- Average revenue per member
- Operating cost per square foot of facility
- Staff-to-member ratios
- Member check-in frequency
- Renewal rates by membership tier
These comparisons help justify budget requests and strategic initiatives. When you can show that similar clubs operate with one fewer admin position because they've automated billing, your request for better software gets more support.
Turning Reports Into Action Plans
The point of management reporting software isn't pretty charts. It's making better decisions faster.
Weekly Operations Review
Every Monday morning, review three quick reports:
- Last week's check-in patterns: Spot capacity issues or underutilized hours
- Current week's expected renewals: Know who to follow up with
- Outstanding balance summary: Identify accounts needing attention
This 10-minute review tells you where to focus your week. Maybe utilization is down on weekday mornings, so you promote early-bird discounts. Maybe 23 accounts need renewal reminders this week. Maybe balances over 90 days need collection calls.
Monthly Board Packets
Don't dump raw reports on your board. They don't have time to interpret data.
Create a one-page executive summary:
- Three key wins from the month (growth, improvements, achievements)
- Two areas of concern (declining trends, emerging issues)
- One decision needed from the board (approval, guidance, resources)
Attach the detailed reports as backup, but lead with the summary. This respects board members' time and focuses discussion on decisions rather than data review.
According to Deloitte's framework for insights and action , effective management reporting transforms data into clear narratives that drive stakeholder decisions rather than simply presenting numbers.
Quarterly Strategic Planning
Once per quarter, dig deeper:
- Compare actual performance to annual budget and projections
- Analyze trends across multiple months to spot patterns
- Review member feedback alongside utilization data
- Assess staff efficiency metrics and training needs
This quarterly review shapes your strategic adjustments. Maybe summer utilization data suggests adding Saturday morning lap swim hours. Maybe renewal patterns indicate you should restructure membership tiers. Maybe revenue trends support hiring seasonal staff earlier next year.
How Modern Clubs Use Reporting to Increase Revenue
Let's get practical. Here's how swim clubs use management reporting software to make more money and reduce waste.
Identifying Revenue Leakage
Revenue leakage happens when you should be collecting money but aren't. Common sources:
- Failed credit card charges that never get retried
- Guests who check in but don't pay the guest fee
- Family accounts where one member has aged out of youth rates
- Expired memberships still checking in during grace periods
Management reporting software catches these issues by:
- Flagging failed payments for immediate retry
- Cross-referencing check-ins against payment records
- Alerting when member ages require rate adjustments
- Identifying accounts checking in past expiration dates
One club I know discovered $4,200 in monthly revenue leakage by running a simple report that compared active check-ins to paid memberships. They had 31 expired accounts still using the facility.
The revenue recovery features in specialized club management platforms automate this detection process, surfacing money you're entitled to collect but currently missing.
Optimizing Membership Pricing
Your reports show exactly how members use different tiers:
| Membership Tier | Monthly Price | Avg Check-ins/Month | Price per Visit |
|---|---|---|---|
| Individual | $59 | 8.3 | $7.11 |
| Couple | $89 | 11.2 | $7.95 |
| Family (3-4) | $129 | 18.6 | $6.93 |
| Family (5+) | $149 | 24.1 | $6.18 |
This data reveals whether your pricing makes sense. If couples are barely using their memberships more than individuals, maybe the couple rate is too high. If large families generate the best value per visit, you might promote that tier more heavily.
Reducing Operational Waste
Reports that track staff time and resource allocation help you operate more efficiently:
- Check-in reports show when you need two front desk staff versus one
- Support ticket data reveals which processes confuse members most
- Payment method reports indicate when to promote autopay over manual billing
- Waiver compliance reports show who's creating more paperwork
Reducing wasted staff time and streamlining processes increases profitability without raising prices.
Getting Your Team to Actually Use Reporting Tools
The best management reporting software fails if your team ignores it. Here's how to drive adoption.
Train Everyone on Their Specific Reports
Don't train your whole team on every feature. Show people the exact three reports they'll use in their role.
Front desk staff need:
- Today's expected check-ins
- Member account status lookup
- Guest pass verification
Operations managers need:
- Weekly utilization trends
- Capacity planning reports
- Staff scheduling data
Financial team needs:
- Revenue collection reports
- Aging balance summaries
- Budget variance analysis
Role-specific training takes 15 minutes instead of 90 minutes, and people actually remember what they learned.
Build Reporting Into Regular Workflows
Make reporting a routine part of existing processes:
- Start shift meetings with a quick look at today's check-in forecast
- Begin budget meetings by pulling up month-to-date revenue
- Open board meetings with the dashboard already displayed
When reporting becomes habitual rather than optional, adoption happens naturally.
Share Wins Publicly
When a report helps someone solve a problem, tell the story:
"Sarah noticed in Friday's utilization report that our lap lanes sit empty from 2-4 PM. She reached out to the local masters swim group, and they're now renting those hours. That's an extra $800/month we weren't making before."
These stories show the value of paying attention to your data.
Making the Switch From Spreadsheets
If you're currently running reports in Excel, moving to dedicated management reporting software feels like a big change. Here's how to make the transition smooth.
Run Parallel Systems for One Month
Don't quit your spreadsheets cold turkey. For the first month, run both systems side by side:
- Build your monthly board report in Excel like always
- Build the same report in your new software
- Compare the numbers
This parallel approach catches any data mapping issues while the stakes are low. It also builds your confidence in the new system.
Document Your Report Formulas
Before you abandon your spreadsheets, document what calculations they're doing. Your "active member count" in Excel might exclude members on seasonal hold, while the software counts everyone with non-cancelled status.
Understanding these calculation differences prevents confusion when numbers don't match exactly.
Automate Your Most Time-Consuming Report First
Whatever report currently eats the most of your time, that's your first target. If you spend 90 minutes every month building the treasurer's revenue breakdown, making that automatic creates immediate value.
Quick wins build momentum for tackling more complex reporting needs.
When you're ready to switch club management software , having a clear migration plan that includes parallel reporting periods reduces risk and ensures continuity for your board and finance team.
The Real Cost of Not Having Reporting Software
Let's talk about what staying with manual processes actually costs your club.
Opportunity Cost of Manager Time
Every hour you spend building reports is an hour you're not spending on member experience, facility improvements, or strategic planning.
If your loaded salary is $35/hour and you spend five hours monthly on manual reporting, that's $2,100 per year. What could you accomplish with those 60 hours back?
Better uses of that time:
- Personal outreach to 30 at-risk members before they cancel
- Planning and executing a member appreciation event
- Developing new programming based on utilization insights
- Training staff on better customer service
Decision Delays and Missed Opportunities
Without easy access to data, you delay decisions. You tell the board "I'll look into that and report back next month" instead of answering on the spot.
Meanwhile:
- A pricing adjustment that could have happened in March waits until May
- A staffing issue that should have been addressed in week one drags into week six
- A facility scheduling opportunity sits unfilled while you gather data
Fast access to accurate data speeds up decision-making. According to Deloitte's research on modernizing management reporting , organizations that implement dashboard-driven delivery and analytics significantly reduce the time between insight and action.
Error Risk and Credibility Loss
Manual reports introduce errors. Copy-and-paste mistakes. Formula bugs. Forgotten data sources.
When you present wrong numbers to your board, they lose confidence in your data. Suddenly every number gets questioned. Simple requests turn into lengthy explanations.
Automated reporting eliminates most human error. The calculations stay consistent. The data pulls the same way every time. Your credibility stays intact.
Board and Volunteer Burnout
Board members volunteer their time. When they spend 40 minutes of every meeting reviewing complicated spreadsheets trying to understand basic trends, they get frustrated.
Clear, automated reports that answer questions visually respect everyone's time. Engaged board members stick around longer and contribute more strategically.
Integrating Reporting With Other Club Systems
Management reporting software works best when it connects to all your operational systems.
Member Management Integration
Your member database holds the foundation: who's active, what they've paid, when they joined, when they're due for renewal.
Reporting software should pull this data automatically so membership counts, demographics, and tenure analysis stay current without manual updates.
When you're evaluating platforms, ask about data governance capabilities that ensure member information flows securely and consistently between systems.
Billing and Payment Processing
Financial reports need real-time access to payment data:
- Which charges posted today
- Which payments cleared successfully
- Which credit cards failed
- Which accounts have outstanding balances
Strong integration means your revenue reports reflect deposits you'll see in your bank account, building trust between your reports and your actual cash position.
Check-in and Access Control
Utilization reports depend on accurate check-in data. Integration between your access control system (key fobs, gate codes, mobile app check-ins) and reporting ensures you're tracking actual facility usage, not just who has permission to enter.
Communication Platforms
When reports identify action items (members at risk, high balances, unusual patterns), you need quick ways to reach out.
Integration with email and SMS platforms lets you move from insight to action in minutes. Spot 15 members who haven't checked in this month? Send them a friendly "we miss you" message right from the report.
Future Trends in Club Reporting
Management reporting software continues to evolve. Here's what's coming soon and what smart clubs are preparing for.
AI-Powered Predictive Insights
Instead of just showing you what happened, next-generation reporting predicts what's likely to happen and suggests responses.
Examples in development:
- "Based on current trends, you'll be 15 members below budget at year-end unless you adjust acquisition efforts"
- "These 12 members show behavior patterns associated with 80% cancellation probability in the next 60 days"
- "Your lap lane utilization will likely exceed capacity on Saturday mornings this summer based on registration trends"
These predictive capabilities help you act before problems materialize.
Real-Time Alert Systems
Rather than running reports to find issues, the software alerts you when attention-needed situations arise:
- A spike in check-in failures (possible access control issue)
- Unusual concentration of failed payments (possible processor problem)
- Rapid cancellation rate increase (possible service issue or competitor)
- Facility usage approaching capacity limits
Real-time alerts turn management reporting from a periodic review into an active monitoring system.
Natural Language Queries
Imagine typing "How many members joined last month?" and getting an instant answer, instead of navigating through menus and date pickers.
Natural language interfaces make data accessible to everyone, not just the tech-savvy team members. Board members can ask questions directly instead of waiting for you to build custom reports.
Cross-Facility Benchmarking
For management companies running multiple clubs or facilities with multiple locations, automated benchmarking helps identify high and low performers.
Compare metrics like revenue per member, check-in frequency, and renewal rates across locations. Spot best practices at your top-performing sites and share them across your organization.
The multi-community amenity management capabilities in modern platforms already support this type of comparative reporting, helping organizations learn from their own data across portfolios.
Modern swim clubs run on data, not guesswork. When you can answer board questions in two minutes instead of two hours, you spend more time improving member experience and less time hunting through spreadsheets. Management reporting software transforms how you understand and operate your facility. Clubward brings together member management, billing, check-ins, and reporting in one configurable, AI-powered platform designed specifically for swim clubs, tennis facilities, and HOA pools, so you can focus on running a great club instead of wrestling with data.
From Katelyn Pauley
More from Clubward